Visualizing EV Adoption Trends on the ZIP Code Level
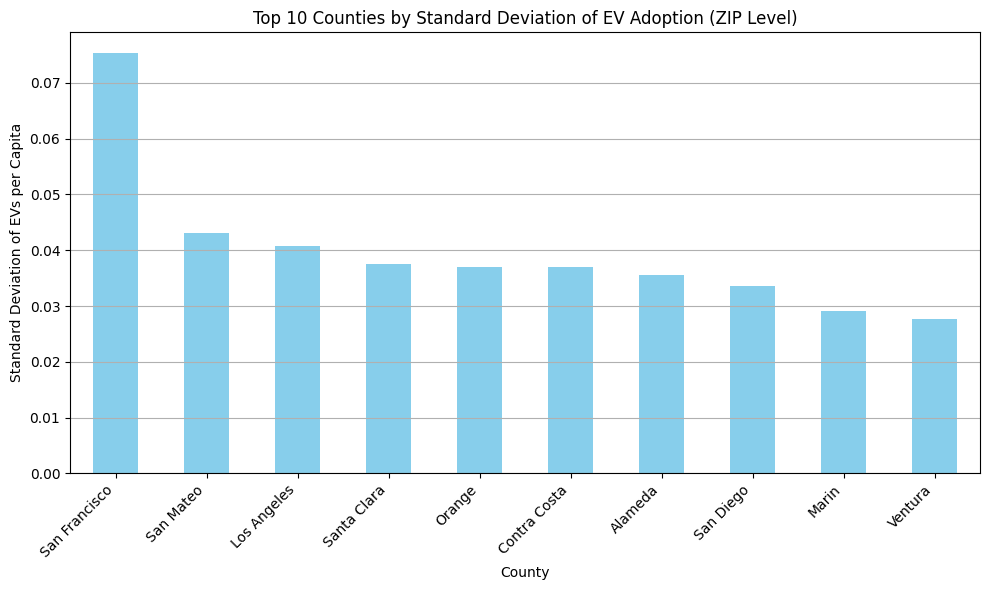
This bar chart shows the ten California counties with the highest variation in EV adoption per capita across ZIP codes.
The metric used is the standard deviation of EVs per capita within each county. San Francisco County ranks highest,
with a standard deviation of approximately 0.075 in EV adoption between its ZIP codes. A standard deviation of 0.075
is substantial given the scale of the data. Most ZIP codes in California have fewer than 0.25 EVs per capita.
This means that a typical ZIP in San Francisco could fall 7.5 percentage points above or below the county average,
which is a wide spread in relative terms. Other counties in the top ten include San Mateo, Los Angeles, and Santa Clara,
all of which show moderate to high variability.
While these counties are often viewed as EV success stories at the aggregate level, this analysis reveals that adoption
is not necessarily evenly distributed. This analysis shows that even in counties with strong overall EV adoption,
there can be internal disparities.
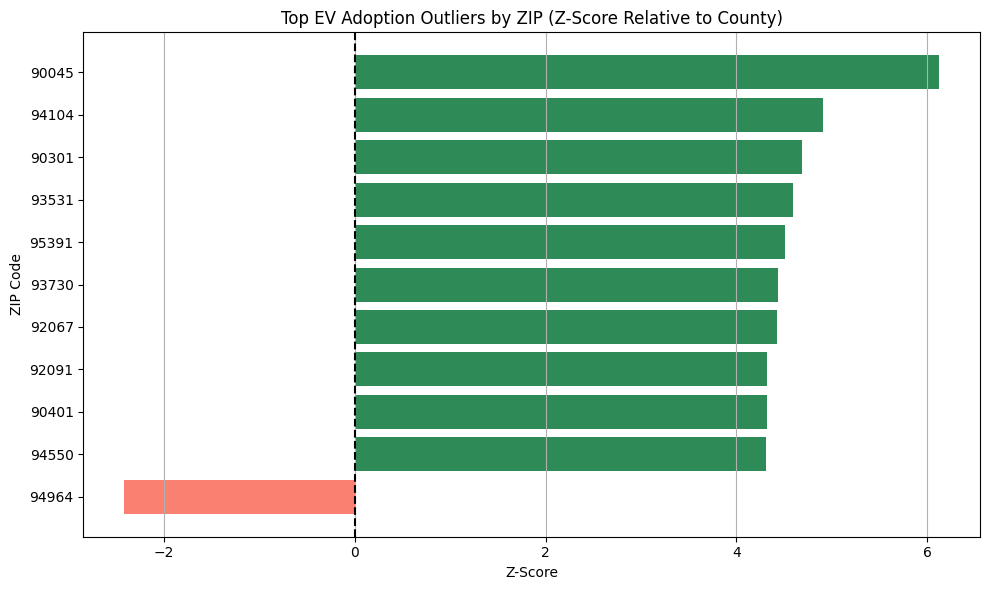
This bar chart shows the Z-scores of ZIP codes with the highest and lowest EV adoption rates relative to their respective county averages.
The z-score measures how far away a value is from the average in terms of standard deviations. Z-scores greater than 2 indicate overperforming
ZIP codes (higher EV adoption than expected based on the county mean). Z-scores below -2 indicate underperforming ZIP codes (lower adoption rates).
The chart shows the top 10 overperforming and underperforming ZIP codes, with green bars for overperformers and red for underperformers.
In this dataset, only one zip code had an EV adoption rate over two standard deviations below the county average. The red bar at the bottom represents
ZIP code 94964, which is the most significant underperformer in the dataset. This outlier analysis helps identify areas where EV adoption is significantly
higher or lower than expected within their counties.
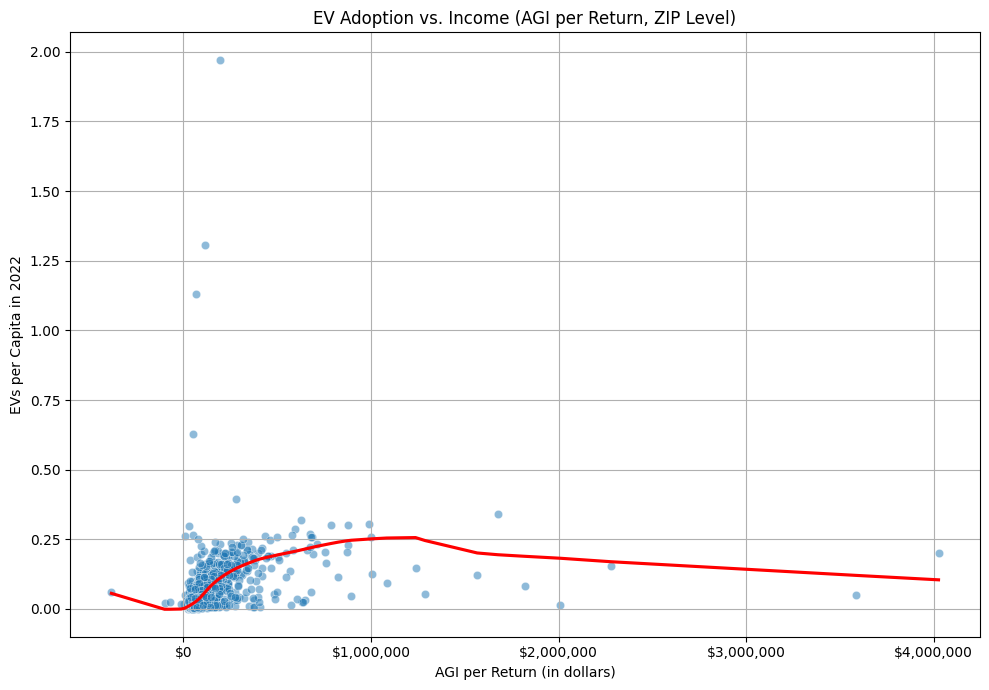
This scatter plot visualizes the relationship between average income and EV adoption at the ZIP-code level in California.
The x-axis shows Adjusted Gross Income (AGI) per tax return in 2022. The y-axis shows the number of EVs per capita,
calculated as the number of registered electric vehicles divided by the number of returns filed in each ZIP code.
Each point represents a ZIP code, and the red line shows a LOWESS (locally weighted smoothing) curve to model the overall trend.
The plot displays a non-linear relationship. EV adoption generally increases with income up to around $1 million in AGI per return,
but then declines slightly at the highest income levels.